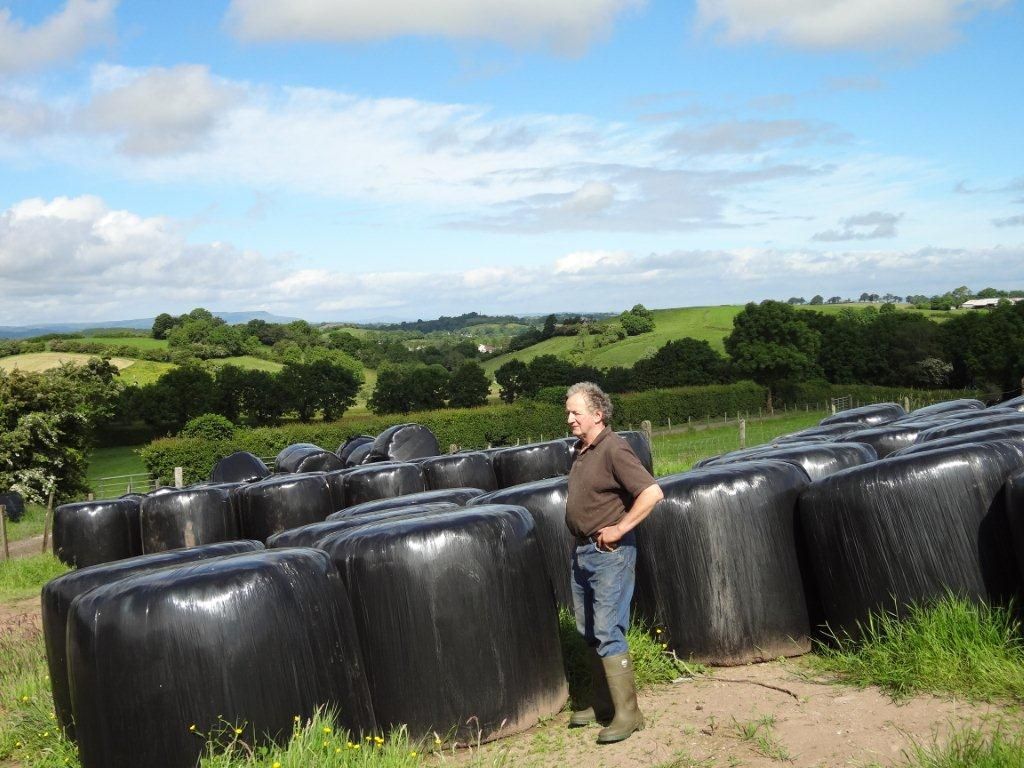
Sheep supplies struggle to match demand

| Week Ending | % Change | Average to Date | % Ch | ||||
|---|---|---|---|---|---|---|---|
| 24.06.2012 | 22.06.2013 | Prev.Week | Prev.Year | 2012 | 2013 | ||
| Ireland | 4.65 | 5.05 | 1.6 | 8.6 | 4.92 | 4.74 | -3.7 |
| Spain | 3.73 | 4.44 | 0.0 | 19.0 | 4.01 | 3.57 | -11.0 |
| Northern Ireland | 4.66 | 5.15 | 0.2 | 10.5 | 4.98 | 4.61 | -7.4 |
| New Zealand * | 3.51 | n.a. | n.a. | n.a. | 3.71 | 2.86 | -22.9 |
| Netherlands | 5.55 | 5.36 | -1.5 | -3.4 | 5.39 | 4.95 | -8.2 |
| Great Britain | 5.39 | 5.61 | n.a. | 4.1 | 5.36 | 4.90 | -8.6 |
| Germany | 4.82 | n.a. | n.a. | n.a. | 5.19 | 4.97 | -4.2 |
| France | 6.11 | 6.48 | 2.4 | 6.1 | 6.48 | 6.36 | -1.9 |
| Australia | 3.48 | n.a. | n.a. | n.a. | 3.63 | 3.17 | -12.7 |


Graphs courtesy Bord Bia
Image Shuttlestock